podmanを使って、10分ほどでElasticsearchとKibanaを試してみます。
構成
podman version 3.0.0
elasticsearch 7.10.1
Kibana 7.10.1
elasticsearchをdocker hub取得
podman pull docker.io/library/elasticsearch:7.10.1Kibanaをdocker hub取得
podman pull docker.io/library/kibana:7.10.1取得したイメージを確認します。
# podman images
REPOSITORY                       TAG          IMAGE ID      CREATED       SIZE
docker.io/library/kibana         7.10.1       3e014820ee3f  2 months ago  1.04 GB
docker.io/library/elasticsearch  7.10.1       558380375f1a  2 months ago  783 MB
elasticsearchのコンテナ立ち上げ
podman run -d --name elasticsearch -p 9200:9200 -p 9300:9300 -e "discovery.type=single-node" docker.io/library/elasticsearch:7.10.1elasticsearchの起動確認
以下のように応答があれば、正常に立ち上がっています。
# curl http://localhost:9200
{
  "name" : "08d50f6d95bf",
  "cluster_name" : "docker-cluster",
  "cluster_uuid" : "CYXXvgAJReqdGsQPZd905g",
  "version" : {
    "number" : "7.10.1",
    "build_flavor" : "default",
    "build_type" : "docker",
    "build_hash" : "1c34507e66d7db1211f66f3513706fdf548736aa",
    "build_date" : "2020-12-05T01:00:33.671820Z",
    "build_snapshot" : false,
    "lucene_version" : "8.7.0",
    "minimum_wire_compatibility_version" : "6.8.0",
    "minimum_index_compatibility_version" : "6.0.0-beta1"
  },
  "tagline" : "You Know, for Search"
}
Kibanaのコンテナ立ち上げ
elasticsearchにhttp://localhost:9200で接続したいので、「net=host」のオプションを設定しています。
podman run -d --name kibana --net=host -e "ELASTICSEARCH_HOSTS=http://localhost:9200" docker.io/library/kibana:7.10.11分しないぐらいでWeb ブラウザから http://localhost:5601 でKibanaに接続できます。外部から接続する場合は、localhost部分はIPアドレスに変更してください。

Kibanaでクエリを試す
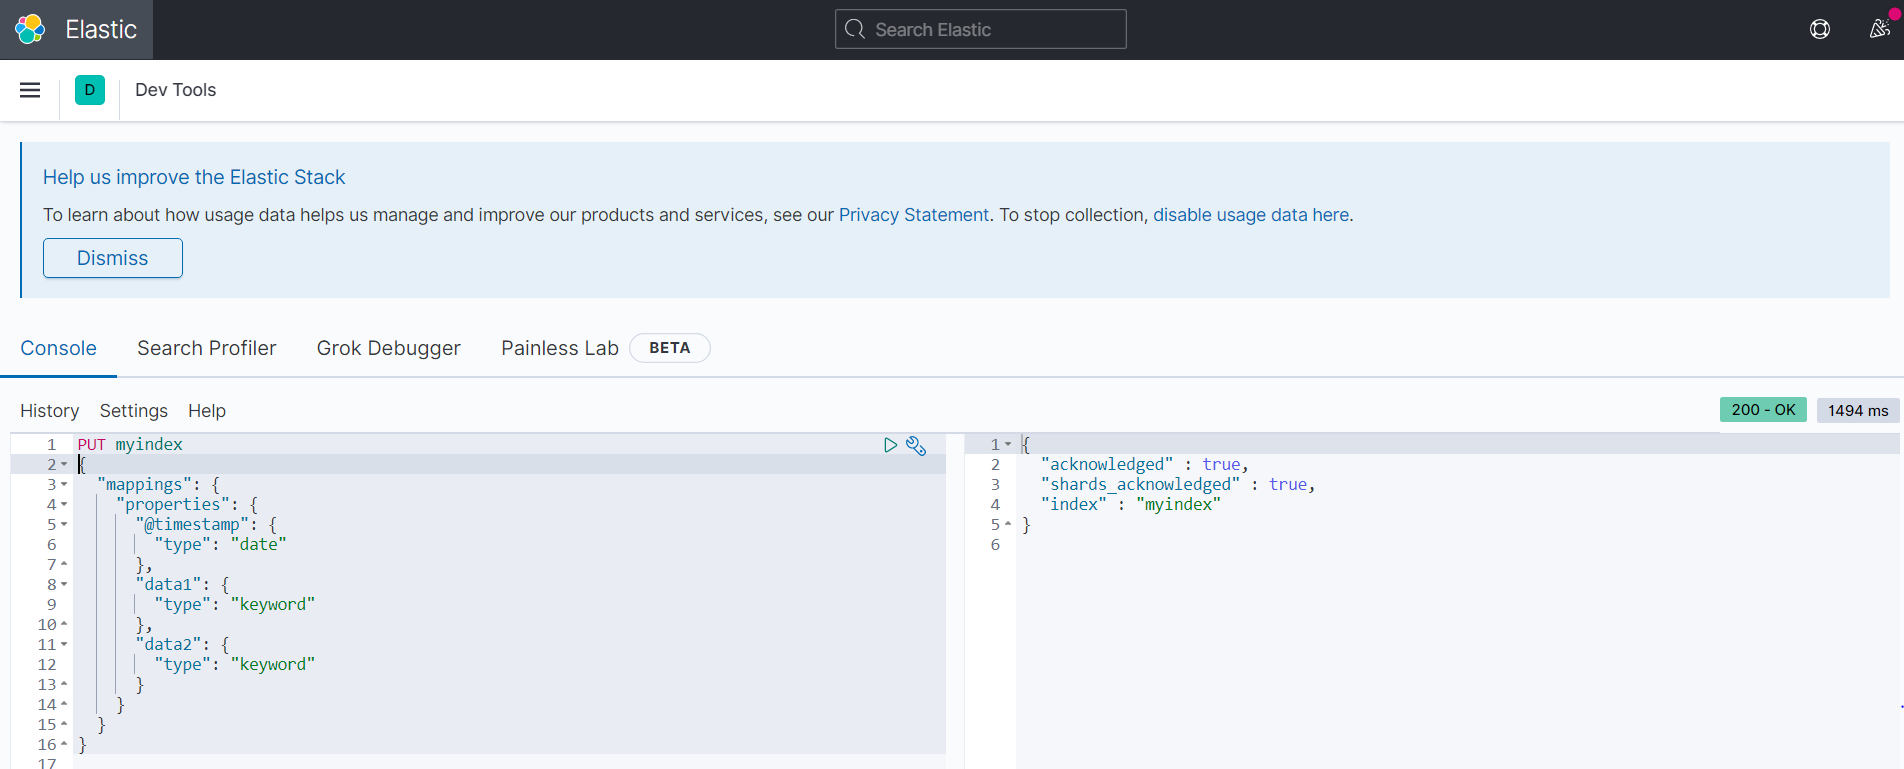
左サイドのメニューからDev Toolsをクリックします。

インデックスを作成する
PUT myindex
{
  "mappings": {
    "properties": {
      "@timestamp": {
        "type": "date"
      },
      "data1": {
        "type": "keyword"
      },
      "data2": {
        "type": "keyword"
      }
    }
  }
}
データ投入
PUT myindex/_doc/1
{
  "@timestamp":"2021-02-16",
  "data1":"aiueo",
  "data2":"xxxyyy"
}
インデックスの内容確認
GET myindex/_doc/1結果
{
  "_index" : "myindex",
  "_type" : "_doc",
  "_id" : "1",
  "_version" : 1,
  "_seq_no" : 0,
  "_primary_term" : 1,
  "found" : true,
  "_source" : {
    "@timestamp" : "2021-02-16",
    "data1" : "aiueo",
    "data2" : "xxxyyy"
  }
}
インデックス検索
GET myindex/_search?pretty
{
  "query": {
    "match_all": {}
  }
}
結果
{
  "_index" : "myindex",
  "_type" : "_doc",
  "_id" : "1",
  "_version" : 1,
  "_seq_no" : 0,
  "_primary_term" : 1,
  "found" : true,
  "_source" : {
    "@timestamp" : "2021-02-16",
    "data1" : "aiueo",
    "data2" : "xxxyyy"
  }
}
Elasticsearch SQLでSQL文でインデックス検索
POST _sql?format=txt
{
  "query":"select * from myindex"
}
結果
       @timestamp       |     data1     |     data2
------------------------+---------------+---------------
2021-02-16T00:00:00.000Z|aiueo          |xxxyyy
SQL文がどのようなクエリを飛ばしているか確認も可能です。
POST _sql/translate
{
  "query":"select * from myindex"
}
結果
{
  "size" : 1000,
  "_source" : false,
  "stored_fields" : "_none_",
  "docvalue_fields" : [
    {
      "field" : "@timestamp",
      "format" : "epoch_millis"
    },
    {
      "field" : "data1"
    },
    {
      "field" : "data2"
    }
  ],
  "sort" : [
    {
      "_doc" : {
        "order" : "asc"
      }
    }
  ]
}
インデックスを調べる
GET /_cat/indices?vインデックスの削除
DELETE myindex